Thursday, November 15, 2012

Military History and data: the US Navy in World War II

A stray idea left over from my whaling series: just how much should digital humanists be flocking to military history? Obviously the field is there a bit already: the Digital Scholarship lab at Richmond in particular has a number of interesting Civil War projects, and the Valley of the Shadow is one of the archetypal digital history projects. But it's possible someone could get a lot of mileage out of doing a lot more.

There are two opportunistic reasons to think so.

1. Digital historians have always been very interested in public audiences; military history has always been one of the keenest areas of public interest.

2. The data is there for algorithmic exploration. In most countries, no organization is better at keeping structured records than the military.

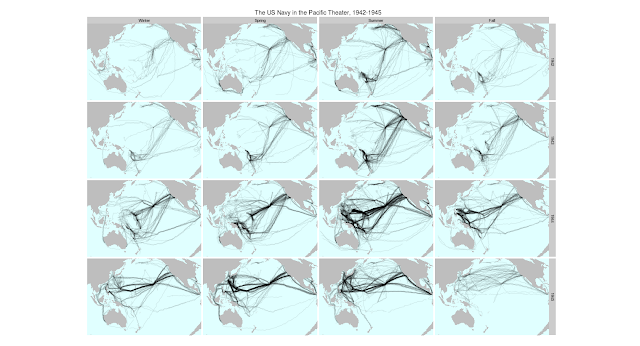
And the stuff is interesting. It's easy, for example,to pull out the locations of nearly the entire US Navy, season-by-season, in the Pacific Theater:
Click to enlarge.
Or even animate them and the less comprehensive Japanese records to show the tide of battle (America in blue, Japan in red):

Reading digital sources: a case study in ship's logs

[Temporary note, March 2015: those arriving from reddit may also be interested in this post, which has a bit more about the specific image and a few more like it.]

Digitization makes the most traditional forms of humanistic scholarship more necessary, not less. But the differences mean that we need to reinvent, not reaffirm, the way that historians do history.


This month, I've posted several different essays about ship's logs. These all grew out of a single post; so I want to wrap up the series with an introduction to the full set. The motivation for the series is that a medium-sized data set like Maury's 19th century logs (with 'merely' millions of points) lets us think through in microcosm the general problems of reading historical data. So I want in this post to walk through the various parts I've posted to date as a single essay in how we can use digital data for historical analysis.

The central conclusion is this: To do humanistic readings of digital data, we cannot rely on either traditional humanistic competency or technical expertise from the sciences. This presents a challenge for the execution of research projects on digital sources: research-center driven models for digital humanistic resource, which are not uncommon, presume that traditional humanists can bring their interpretive skills to bear on sources presented by others.

All voyages from the ICOADS US Maury collection. Ships tracks in black, plotted on a white background, show the outlines of the continents and the predominant tracks on the trade winds. 


We need to rejuvenate three traditional practices: first, a source criticism that explains what's in the data; second, a hermeneutics that lets us read data into a meaningful form; and third, situated argumentation that ties the data in to live questions in their field.
Wednesday, November 14, 2012

Where are the individuals in data-driven narratives?

Note: this post is part 5 of my series on whaling logs and digital history. For the full overview, click here.

In the central post in my whaling series, I argued data presentation offers historians an appealing avenue for historical argumentation, analogous in importance to the practice of shaping personal stories into narratives in more traditional histories. Both narratives and data presentations can appeal to a broader public than more technical parts of history like historiography; and both can be crucial in making arguments persuasive, although they rarely constitute an argument in themselves. But while narratives about people ensure that histories are fundamentally about individuals, working with data generally means we'll be dealing with aggregates of some sort. (In my case, 'voyages' by 'whaling ships'.*)

*I put those in quotation marks because, as described at greater length in the technical methodology post, what I give are only the best approximations I could get of the real categories of oceangoing voyages and of whaling ships.

This is, depending on how you look at it, either a problem or an opportunity. So I want to wrap into this longer series a slightly abtruse--technical from the social theory side rather than the algorithmic side--justification for why we might not want to linger over individual experiences.

One major reason to embrace digital history is precisely that it lets us tell stories that are fundamentally about collective actions--the 'swarm' of the whaling industry as a whole--rather than traditional subjective accounts. While it's discomforting to tell histories without individuals, that discomfort is productive for the field; we need a way to tell those histories, and we need reminders they exist. In fact, those are just the stories that historians are becoming worse and worse at telling, even as our position in society makes us need them more and more.

Friday, November 2, 2012

When you have a MALLET, everything looks like a nail

Note: this post is part 4, section 2 of my series on whaling logs and digital history. For the full overview, click here.

One reason I'm interested in ship logs is that they give some distance to think about problems in reading digital texts. That's particularly true for machine learning techniques. In my last post, an appendix to the long whaling post, I talked about using K-means clustering and k-nearest neighbor methods to classify whaling voyages. But digital humanists working with texts hardly ever use k-means clustering; instead, they gravitate towards a more sophisticated form of clustering called topic modeling, particularly David Blei's LDA (so much so that I'm going to use 'LDA' and 'topic modeling' synonymously here). There's a whole genre of introductory posts out there encouraging humanists to try LDA: Scott Weingart's wraps a lot of them together, and Miriam Posner's is freshest off the presses.

So as an appendix to that appendix, I want to use ship's data to think about how we use LDA. I've wondered for a while why there's such a rush to make topic modeling into the machine learning tool for historians and literature scholars. It's probably true that if you only apply one algorithm to your texts, it should be LDA. But most humanists are better off applying zero clusterings, and most of the remainder should be applying several. I haven't mastered the arcana of various flavors of topic modeling to my own satisfaction, and don't feel qualified to deliver a full-on jeremiad against its uses and abuses. Suffice it to say, my basic concerns are:

  1. The ease of use for LDA with basic settings means humanists are too likely to take its results as 'magic', rather than interpreting it as the output of one clustering technique among many.
  2. The primary way of evaluating its result (confirming that the top words and texts in each topic 'make sense') ignores most of the model output and doesn't map perfectly onto the expectations we have for the topics. (A Gary King study, for example, that empirically ranks document clusterings based on human interpretation of 'informativeness' found Direchlet-prior based clustering the least effective of several methods.)

Ship data gives an interesting perspective on these problems. So, at the risk of descending into self-parody, I ran a couple topic models on the points in the ship's logs as a way of thinking through how that clustering works. (For those who only know LDA as a text-classification system, this isn't as loony as it sounds; in computer science, the algorithm gets thrown at all sorts of unrelated data, from images to music).

Instead of using a vocabulary of words, we can just use one of latitude-longitude points at decimal resolution. Each voyage is a text, and each day it spends in, say, Boston is one use of the word "42.4,-72.1". That gives us a vocabulary of 600,000 or so 'words' across 11,000 'texts', not far off a typical topic model (although the 'texts' are short, averaging maybe 30-50 words). Unlike k-means clustering, a topic model will divide each route up among several topics, so instead of showing paths, we can visually only look at which points fall into which 'topic'; but a single point isn't restricted to a single topic, so New York could be part of both a hypothetical 'European trade' and 'California trade' topic.

With words, it's impossible to meaningfully convey all the data in a topic model's output. Geodata has the nice feature that we can inspect all the results in a topic by simply plotting them on a map. Essentially, 'meaning' for points can be firmly reduced a two-dimensional space (although it has other ones as well), while linguistic meaning can't.

Here's the output of a model, plotted with high transparency so that a point on the map will appear black if it appears in that topic in 100 or more log entries. (The basic code to build the model and plot the code is here--dataset available on request).


Click to enlarge

Thursday, November 1, 2012

Machine Learning at sea

Note: this post is part 4 of my series on whaling logs and digital history. For the full overview, click here.

As part of my essay visualizing 19th-century American shipping records, I need to give a more technical appendix on machine learning: it discusses how I classified whaling vessels as an example of how supervised and unsupervised machine learning algorithms, including the ubiquitous topic modeling, can help work with historical datasets.

For context: here's my map that shows shifting whaling grounds by extracting whale voyages from the Maury datasets. Particularly near the end, you might see one or two trips that don't look like whaling voyages; they probably aren't. As with a lot of historical data, the metadata is patchy, and it's worth trying to build out from what we have to what's actually true. To supplement I made a few leaps of faith to pull whaling trips out of the database: here's how.