Mostly a note to myself:
I think genre data would be helpful in all sorts of ways--tracking evolutionary language through different sciences, say, or finding what discourses are the earliest to use certain constructions like "focus attention." The Internet Archive books have no genre information in their metadata, for the most part. The genre data I think I want to use would Library of Congress call numbers--that divides up books in all sorts of ways at various levels that I could parse. It's tricky to get from one to the other, though. I could try to hit the LOC catalog with a script that searches for title, author and year from the metadata I do have, but that would miss a lot and maybe have false positives, plus the LOC catalog is sort of tough to machine-query. Or I could try to run a completely statistical clustering, but I don't trust that that would come out with categories that correspond to ones in common use. Some sort of hybrid method might be best--just a quick sketch below.
Tuesday, November 30, 2010
Sunday, November 28, 2010
Top ten authors
Most intensive text analysis is done on heavily maintained sources. I'm using a mess, by contrast, but a much larger one. Partly, I'm doing this tendentiously--I think it's important to realize that we can accept all the errors due to poor optical character recognition, occasional duplicate copies of works, and so on, and still get workable materials.
Using worse sources is something of a necessity for digital history. The text recognition and the metadata for a lot of the sources we use often—google books, jstor, proquest—is full of errors under the surface, and it's OK for us to work with such data in the open. The historical profession doesn't have any small-ish corpuses we would be interested in analyzing again and again. This isn't true of English departments, who seem to be well ahead of historians in computer-assisted text analysis, and have the luxury of emerging curated text sources like the one Martin Mueller describes here.
But the side effect of that is that we need to be careful about understanding what we're working with. So I'm running periodic checks on the data in my corpus of books by major American publishers (described more earlier) to see what's in there. I thought I'd post the list of the top twenty authors, because I found it surprising, though not in a bad way. We'll do from no. 20 ranking on up, because that's how they do it on sports blogs. (What I really should do is a slideshow to increase pageviews). I'll identify the less famous names.
Clustering isms together
In addition to finding the similarities in use between particular isms, we can look at their similarities in general. Since we have the distances, it's possible to create a dendrogram, which is a sort of family tree. Looking around the literary studies text-analysis blogs, I see these done quite a few times to classify works by their vocabulary. I haven't seen much using words, though: but it works fairly well. I thought it might help answer Hank's question about the difference between evolutionism and darwinism, but, as you'll see, that distinction seems to be a little too fine for now.
Here's the overall tree of the 400-ish isms, with the words removed, just to give a sense. We can cut the tree at any point to divide into however many groups we'd like. The top three branches essentially correspond to 1) Christian and philosophical terminology, 2) social, historical, and everything else, and 3) medical and some scientific terminology.

Here's the overall tree of the 400-ish isms, with the words removed, just to give a sense. We can cut the tree at any point to divide into however many groups we'd like. The top three branches essentially correspond to 1) Christian and philosophical terminology, 2) social, historical, and everything else, and 3) medical and some scientific terminology.
But you probably want to see the actual words.
Friday, November 26, 2010
Comparing usage patterns across the isms
What can we do with this information we’ve gathered about unexpected occurrences? The most obvious thing is simply to look at what words appear most often with other ones. We can do this for any ism given the data I’ve gathered. Hank asked earlier in the comments about the difference between "Darwinism" and evolutionism, so:
> find.related.words("darwinism",matrix = "percent.diff", return=5)
phenomenism evolutionism revolutionism subjectivism hermaphroditism
2595.147 1967.021 1922.339 1706.679 1681.792
Phenomenism appears 2,595%—26 times—more often in books about Darwin than chance would imply. That revolutionism is so high is certainly interesting, and maybe there’s some story out there about why hermaphroditism is so high. The takeaway might be that Darwinism appears as much in philosophical literature as scientific, which isn’t surprising.
But we don’t just have individual counts for words—we have a network of interrelated meanings that lets us compare the relations across all the interrelations among words. We can use that to create a somewhat different list of words related to Darwinism:
Measuring word collocation, part III
Now to the final term in my sentence from earlier— “How often, compared to what we would expect, does a given word appear with any other given word?”. Let’s think about How much more often. I though this was more complicated than it is for a while, so this post will be short and not very important.
Basically, I’m just using the percentage of time more often as the measuring stick—I fiddled around with standard deviations for a while, but I don’t have a good way to impute expected variations, and percentages seems to work well enough. I do want to talk for a minute about an aspect that I’ve glossed over so far—how do we measure the occurrences of a word relative to itself?
As I think of things

Abraham Lincoln invented Thanksgiving. And I suppose this might be a good way to prove to more literal-minded students that the Victorian invention of tradition really happened. Other than that, I don't know what this means.
Measuring word collocation, part II
This is the second post on ways to measure connections—or more precisely, distance—between words by looking at how often they appear together in books. These are a little dry, and the payoff doesn't come for a while, so let me remind you of the payoff (after which you can bail on this post). I’m trying to create some simple methods that will work well with historical texts to see relations between words—what words are used in similar semantic contexts, what groups of words tend to appear together. First I’ll apply them to the isms, and then we’ll put them in the toolbox to use for later analysis.
I said earlier I would break up the sentence “How often, compared to what we would expect, does a given word appear with any other given word?” into different components. Now let’s look at the central, and maybe most important, part of the question—how often do we expect words to appear together?
I said earlier I would break up the sentence “How often, compared to what we would expect, does a given word appear with any other given word?” into different components. Now let’s look at the central, and maybe most important, part of the question—how often do we expect words to appear together?
Thursday, November 25, 2010
Back from Moscow--where to now?
I’m back from Moscow, and with a lot of blog content from my 23-hour itinerary. I’m going to try to dole it out slowly, though, because a lot of it is dull and somewhat technical, and I think it’s best to intermix with other types of content. I think there are four things I can do here.
1. Document my process of building up a specific system and set of techniques for analyzing texts from the internet archive, and publishing an account my tentative explorations into the structure of my system.
2. Trying to produce some chunks of writing that I could integrate into presentations (we’re talking about one in Princeton in February) and other non-blog writing.
3. Digging in with the data into some major questions in American intellectual history to see whether we can get anything useful out of it.
4. Reflecting on the state of textual analysis within the digital humanities, talking about how it can be done outside of my Perl-SQL-R framework, and thinking about how to overcome some of the more gratuitous obstacles in its way.
I’m interested in all of these, but find myself most naturally writing the first two (aside from a few manifestos of type 4 written in a haze of Russia and midnight flights that will likely never see the light of day). I think my two commenters may like the latter two more.
So I think I’ll try to intersperse the large amount of type 1 that I have now with some other sorts of analysis over the next week or so. That includes a remake of the isms chart, a further look at loess curves, etc.
Tuesday, November 23, 2010
Links between words
Ties between words are one of the most important things computers can tell us about language. I already looked at one way of looking at connections between words in talking about the phrase "scientific method"--the percentage of occurrences of a word that occur with another phrase. I've been trying a different tack, however, in looking at the interrelations among the isms. The whole thing has been do complicated--I never posted anything from Russia because I couldn't get the whole system in order in my time here. So instead, I want to take a couple posts to break down a simple sentence and think about how we could statistically measure each component. Here's the sentence:
How often, compared to what we would expect, does a given word appear with any other given word?
In doing the math, we have to work from the back to the front, so this post is about the last part of the sentence: What does it mean to appear with another word?
How often, compared to what we would expect, does a given word appear with any other given word?
In doing the math, we have to work from the back to the front, so this post is about the last part of the sentence: What does it mean to appear with another word?
Thursday, November 18, 2010
More on Grafton
One more note on that Grafton quote, which I'll post below.
“The digital humanities do fantastic things,” said the eminent Princeton historian Anthony Grafton. “I’m a believer in quantification. But I don’t believe quantification can do everything. So much of humanistic scholarship is about interpretation.”
“It’s easy to forget the digital media are means and not ends,” he added.Anne pointed out at dinner that the reason this is so frustrating is because it gives far too much credit to quantification. Grafton has tossed out all the history of science he's been so involved in and pretends he thinks that the quantitative sciences use numbers to reveal irrefutable facts about the world. I'm sure there are people who do believe that they unearth truth through elaborate cliometrics; but those oddballs are far less harmful and numerous than those who think the humanities are about 'interpretations', and the sciences about 'facts.' Again, I bet this in some way this is a misstatement or misquotation. Still, it made it through because it's so representative of how a lot of the profession thinks.
(more below the break)
Wednesday, November 17, 2010
Moscow and NyTimes
I'm in Moscow now. I still have a few things to post from my layover, but there will be considerably lower volume through Thanksgiving.
I don't want to comment too much on yesterday (today's? I can't tell anymore) article about digital humanities in the New York Times, but a couple e-mail people e-mailed about it. So a couple random points:
1. Tony Grafton is, as always, magnanimous: but he makes an unfortunate distinction between "data" and "interpretation" that gives others cover to view digital humanities less charitably than he does. I shouldn't need to say this, but: the whole point of data is that it gives us new objects of interpretation. And the Grafton school of close reading, which seems to generally now involve writing a full dissertation on a single book, is also not a substitute for the full range of interpretive techniques that play on humanistic knowledge.
(more after the break)
Lumpy words
What are the most distinctive words in the nineteenth century? That's an impossible question, of course. But as I started to say in my first post about bookcounts, [link] we can find something useful--the words that are most concentrated in specific texts. Some words appear at about the same rate in all books, while some are more highly concentrated in particular books. And historically, the words that are more highly concentrated may be more specific in their meanings--at the very least, they might help us to analyze genre or other forms of contextual distribution.
Because of computing power limitations, I can't use all of my 200,000 words to analyze genre--I need to pick a subset that will do most of the heavy lifting. I'm doing this by finding outliers on the curve of words against books. First, I'll show you that curve again. This time, I've made both axes logarithmic, which makes it easier to fit a curve. And the box shows the subset I'm going to zoom in on for classification--dropping a) the hundred most common words, and b) any words that appear in less than 5% of all books. The first are too common to be of great use (and confuse my curve fitting), and the second are so rare I'd need too many of them to make for useful categorization.

(more after the break)
Monday, November 15, 2010
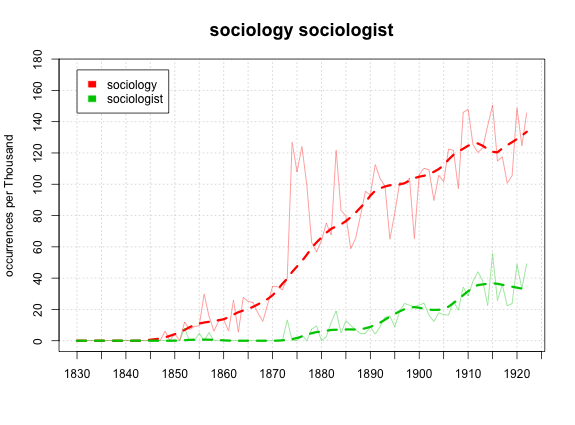
Isms and ists
Hank asked for a couple of charts in the comments, so I thought I'd oblige. Since I'm starting to feel they're better at tracking the permeation of concepts, we'll use appearances per 1000 books as the y axis:
And Darwin after the break.
And Darwin after the break.
Similar Trends in Words
I'm going to keep looking at the list of isms, because a) they're fun; and b) the methods we use on them can be used on any group of words--for example, ones that we find are highly tied to evolution. So, let's use them as a test case for one of the questions I started out with: how can we find similarities in the historical patterns of emergence and submergence of words?
Well, let's take a few things for granted. First, we're interested in relative trends: we want to compare all words, say, that get twice as popular during World War I, regardless of how popular they were before. It's easy to normalize for that, but we're still left with a mess of different curves. Below the jump is a very ugly chart, with the adjusted loess curves for the 300 most popular isms, with "1" being a year in which a word is used its average amount.
Well, let's take a few things for granted. First, we're interested in relative trends: we want to compare all words, say, that get twice as popular during World War I, regardless of how popular they were before. It's easy to normalize for that, but we're still left with a mess of different curves. Below the jump is a very ugly chart, with the adjusted loess curves for the 300 most popular isms, with "1" being a year in which a word is used its average amount.
Sunday, November 14, 2010
Century of -isms, take one
Here's a fun way of using this dataset to convey a lot of historical information. I took all the 414 words that end in ism in my database, and plotted them by the year in which they peaked,* with the size proportional to their use at peak. I'm going to think about how to make it flashier, but it's pretty interesting as it is. Sample below, and full chart after the break.

Saturday, November 13, 2010
Infrastructure
It's time for another bookkeeping post. Read below if you want to know about changes I'm making and contemplating to software and data structures, which I ought to put in public somewhere. Henry posted questions in the comments earlier about whether we use Princeton's supercomputer time, and why I didn't just create a text scatter chart for evolution like the one I made for scientific method. This answers those questions. It also explains why I continue to drag my feet on letting us segment counts by some sort of genre, which would be very useful.
Back to Darwin
Henry asks in the comments whether the decline in evolutionary thought in the 1890s is the "'Eclipse of Darwinism,' rise or prominence of neo-Lamarckians and saltationism and kooky discussions of hereditary mechanisms?" Let's take a look, with our new and improved data (and better charts, too, compared to earlier in the week--any suggestions on design?). First,three words very closely tied to the theory of natural selection.

Three rises from around 1859, Origin's publication date (obviously the numbers for Spencer are inflated by other Spencers in the world, but the trend seems like it might be driven by Herbert); and three peaks at different points from 1885 to 1900, followed by a fall and perhaps a recovery. The question is: how significant are those falls, and how can we interpret them? First, let's look at the bookcounts: are those falls a result of less intensive discussion of the subjects, or of a waning in interest across all books?
Friday, November 12, 2010
Wordcounts in starting research--what do we have now?
All right, let's put this machine into action. A lot of digital humanities is about visualization, which has its place in teaching, which Jamie asked for more about. Before I do that, though, I want to show some more about how this can be a research tool. Henry asked about the history of the term 'scientific method.' I assume he was asking a chart showing its usage over time, but I already have, with the data in hand, a lot of other interesting displays that we can use. This post is a sort of catalog of what some of the low-hanging fruit in text analysis are.
The basic theory I'm working on here is that textual analysis isn't necessarily about answering research questions. (It's not always so good at doing that.) It can also help us channel our thinking into different directions. That's why I like to use charts and random samples rather than lists--they can help us come up with unexpected ideas, and help us make associations that wouldn't come naturally. Essentially, it's a different form of reading--just like we can get different sorts of ideas from looking at visual evidence vs. textual evidence, so can we get yet other ideas by reading quantitative evidence. The last chart in the post is good for that, I think. But first things first: the total occurrences of "scientific method" per thousand words.

This is what we've already had. But now I've finally got those bookcounts running too. Here is the number of books per thousand* that contain the phrase "scientific method":
The basic theory I'm working on here is that textual analysis isn't necessarily about answering research questions. (It's not always so good at doing that.) It can also help us channel our thinking into different directions. That's why I like to use charts and random samples rather than lists--they can help us come up with unexpected ideas, and help us make associations that wouldn't come naturally. Essentially, it's a different form of reading--just like we can get different sorts of ideas from looking at visual evidence vs. textual evidence, so can we get yet other ideas by reading quantitative evidence. The last chart in the post is good for that, I think. But first things first: the total occurrences of "scientific method" per thousand words.
Thursday, November 11, 2010
Bookcounts are in
I now have counts for the number of books a word appears in, as well as the number of times it appeared. Just as I hoped, it gives a new perspective on a lot of the questions we looked at already. That telephone-telegraph-railroad chart, in particular, has a lot of interesting differences. But before I get into that, probably later today, I want to step back and think about what we can learn from the contrast between between wordcounts and bookcounts. (I'm just going to call them bookcounts--I hope that's a clear enough phrase).
Roughly, wordcounts are how many times a word is said in my library, and bookcounts is how many different authors are saying it--or how many different readers are reading it. (Given prolific authors, multiple authors, etc. that's not quite true, but it's still an OK way to think about it). Since this is a quantitative blog, let's start with a chart. Here are the two different counts simply plotted against each other (please someone e-mail me if these image files don't come through as well as the earlier ones):
 Each of the 200,000 points is a word--from "the," all the way up in the upper right hand corner, to a whole morass of words we've all forgotten and typos, down in the lower left. The red line is the theoretical minimum-- a word appearing in exactly as many books as is its word count.* This is abstract, I know, so let's add some of the words we've already been analyzing to the chart to humanize it a little. (By the time we get through with this, my little linguistic studies the last few entries will have taken us back to history, I promise).
Roughly, wordcounts are how many times a word is said in my library, and bookcounts is how many different authors are saying it--or how many different readers are reading it. (Given prolific authors, multiple authors, etc. that's not quite true, but it's still an OK way to think about it). Since this is a quantitative blog, let's start with a chart. Here are the two different counts simply plotted against each other (please someone e-mail me if these image files don't come through as well as the earlier ones):
Wednesday, November 10, 2010
digitizecr by ljooq ic
Obviously, I like charts. But I've periodically been presenting data as a number of random samples, as well. It's a technique that can be important for digital humanities analysis. And it's one that can draw more on the skills in humanistic training, so might help make this sort of work more appealing. In the sciences, an individual data point often has very little meaning on its own--it's just a set of coordinates. Even in the big education datasets I used to work with, the core facts that I was aggregating up from were generally very dull--one university awarded three degrees in criminal science in 1984, one faculty member earned $55,000 a year. But with language, there's real meaning embodied in every point, that we're far better equipped to understand than the computer. The main point of text processing is to act as a sort of extraordinarily stupid and extraordinarily perseverant research assistant, who can bring patterns to our attention but is terrible at telling which patterns are really important. We can't read everything ourselves, but it's good to check up periodically--that's why I do things like see what sort of words are the 300,000th in the language, or what 20 random book titles from the sample are.
So any good text processing application will let us delve into the individual data as well as giving the individual picture. I'm circling around something commenter "Jamie" said, though not addressing it directly: (quote after break)
So any good text processing application will let us delve into the individual data as well as giving the individual picture. I'm circling around something commenter "Jamie" said, though not addressing it directly: (quote after break)
Tuesday, November 9, 2010
How Many Words are there in the English language?
Here's what googling that question will tell you: about 400,000 words in the big dictionaries (OED, Webster's); but including technical vocabulary, a million, give or take a few hundred thousand. But for my poor computer, that's too many, for reasons too technical to go into here. Suffice it to say that I'm asking this question for mundane reasons, but the answer is kind of interesting anyway. No real historical questions in this post, though--I'll put the only big thought I have about it in another post later tonight.
Monday, November 8, 2010
More on Technologies--and, what the graphs show.
I can't resist making a few more comments on that technologies graph that I laid out. I'm going to add a few thousand more books to the counts overnight, so I won't make any new charts until tomorrow, but look at this one again.

You remember I claimed that some intellectual movements spread like technologies, and some like news. But that's only looking at the smoothed curves. As you've probably figured out, I plot two sets of data for each word--a thin solid line for the actual data, and a large dotted line for a smoothed version (for the record, a loess smoothing that looks at 15% of the total for each point). What do the peaks mean?
Diffusion patterns for news and technological events
An anonymous correspondent says:
You mention in the post about evolution & efficiency that "Offhand, the evolution curve looks more the ones I see for technologies, while the efficiency curve resembles news events."He or she is right that technology vs. news isn't quite the right way to describe it. Even in the 19C, some technology changes are news events, while others aren't. But let's look at some examples here.
That's a very interesting observation, and possibly a very important one if it's original to you, and can be substantiated. Do you have an example of a tech vs news event graph? Something like lightbulbs or batteris vs the Spanish American war might provide a good test case.
Also, do you think there might be changes in how these graphs play out over a century? That is, do news events remain separate from tech stuff? Tech changes these days are often news events themselves, and distributed similarly across media.
I think another way to put the tech vs news event could be in terms of the kind of event it is: structural change vs superficial, mid-range event vs short-term.
Anyhow, a very interesting idea, of using the visual pattern to recognize and characterize a change. While I think your emphasis on the teaching angle (rather than research) is spot on, this could be one application of these techniques where it'd be more useful in research.
Back to Basics
I've rushed straight into applications here without taking much time to look at the data I'm working with. So let me take a minute to describe the set and how I'm trimming it.
Sunday, November 7, 2010
Collocation
A collection as large as the Internet Archive's OCR database means I have to think through what I want well in advance of doing it. I'm only using a small subset of their 900,000 Google-scanned books, but that's still 16 gigabytes--it takes a couple hours just to get my baseline count of the 200,000 most common words. I could probably improve a lot of my search time through some more sophisticated database management, but I'll still have to figure out what sort of relations are worth looking for. So what are some?
Taylor vs. Darwin
Let's start with just some of the basic wordcount results. Dan Cohen posted some similar things for the Victorian period on his blog, and used the numbers mostly to test hypotheses about change over time. I can give you a lot more like that (I confirmed for someone, though not as neatly as he'd probably like, that 'business' became a much more prevalent word through the 19C). But as Cohen implies, such charts can be cooler than they are illuminating.
But you can get into some interesting analysis even just at the wordcount level. Look at this chart (sorry if it's small):

The red line is the frequency of the word 'evolution'; the green one, 'efficiency.' (I'll put a post at some point on how to read these graphs better.) Each one of those terms gets a week in your typical intellectual history survey, and each one has a canonical author associated with it. (If you're a little fuzzy, Darwin's Origin of the Species is 1859; Taylor's Scientific Management is 1911, Shop Management 1903). And sure enough, both climb out of the ocean of insignificant words around the time we'd expect them to.
But look at the differences between the two. "Evolution" starts its climb shortly after Darwin publishes (the real spike in the data seems to be 1864, which gives Americans a chance to make it through that book), and rises in prominence for decades. "Efficiency," on the other hand, increases in prominence five times in the first fifteen years of the century, before leveling off a bit. Taylor's most famous work is at middle of the curve, and his first one is part of the rise, not before it. Both words show a major addition to shared cultural vocabulary, but the way they are taken in shows they are two very different intellectual movements.
Saturday, November 6, 2010
Intro
I'm going to start using this blog to work through some issues in finding useful applications for digital history. (Interesting applications? Applications at all?)
Right now, that means trying to figure out how to use large amounts of textual data to draw conclusions or refine questions. I currently have the Internet Archive's OCRed text files for about 30,000 books by large American publishers from 1830 to 1920. I've done this partly to help with my own research, and partly to try a different way of thinking about history and the texts we read.
I'm putting it online to help convince one or two people (I'm looking at you, Henry) that this sort of exploration is important for research and teaching. Not necessarily that it's research itself; I'm still unimpressed by the conclusions I'm getting out of it. But at least that any historian looking at the meanings of words (which is most of us, at least around here) should make some stab at using the texts of books we haven't read. And if I can get some good graphics out of it, maybe we can start to think about how this might be useful in teaching, particularly students who respond better to data than stories.
Anyhow, on with it.
Subscribe to:
Posts (Atom)