What are some interesting, large corpuses to compare? A lot of what we'll be interested in historically are subtle differences between closely related sets, so a good start might be the two Library of Congress subject classifications called "History of the Americas," letters E and F. The Bookworm database has over 20,000 books from each group. What's the difference between the two? The full descriptions could tell us: but as a test case, it should be informative to use only the texts themselves to see the difference.
That leads a tricky question. Just what does it mean to compare usage frequencies across two corpuses? This is important, so let me take this quite slowly. (Feel free to skip down to Dunning if you just want the best answer I've got.) I'm comparing E and F: suppose I say my goal to answer this question:
What words appear the most times more in E than in F, and vice versa?
There's already an ambiguity here: what does "times more" mean? In plain English, this can mean two completely different things. Say E and F are exactly the same overall length (eg, each have 10,000 books of 100,000 words). Suppose further "presbygational" (to take a nice, rare, American history word) appears 6 times in E and 12 times in F. Do we want to say that it appears two times more (ie, use multiplication), or six more times (use addition)?
It turns out that neither of these simple operations works all that well. In the abstract, multiplication probably sounds more appealing; but it turns out to only catch extremely rare words. In our example set, here are the top words that distinguish E from F by multiplication, by occurences in E divided by occurrences in F. For example, "gradualism" appears 61x more often in E than in F.
daimyo aftre exercitum intransitive castris 1994a
114.00000 103.00000 101.00000 82.33333 81.66667 77.00000
sherd infti gradualism imperforate equitum brynge
71.71429 66.00000 61.00000 59.33333 57.00000 56.00000
(BWT, I simply omit the hundreds of words that appear in E but never appear in F; and I don't use capitalized words because they tend to _very_ highly concentrated and in fictional works in particular can cause very strange results. Yes, that's not the best excuse.)
So what about addition? Compensating for different corpus sizes, it's also pretty easy to find out the number of more occurrences than we'd expect based on the previous corpus. (For example, "not" appears about 1.4 million more times than we'd expect in E given the number of times it appears in F and the total number of words in E.)
to that the not had it
3432895.3 2666614.4 2093465.8 1427220.8 1360559.0 1342948.2
be general we but our would
1208340.5 990988.4 974849.0 841842.6 819680.5 798426.0
Clearly, neither of these is working all that well. Basically, the first group are so rare they don't tell us much: and the second group, with the intriguing addition of "general", are so common as to be uninformative. (Except maybe for "our"; more on that later). Is there any way to find words that are interesting on _both_ counts?
I find it helpful to do this visually. Suppose we make a graph. We'll put the addition score on the X axis, and the multiplication one on the Y axis, and make them both on a logarithmic scale. Every dot represents a word, as it scores on both of these things. Where do the words we're talking about fall?

This nicely captures our dilemma. The two groups are in opposite corners, and words don't ever score highly on both. For example, "general" appears about 1,000,000 occurrences more in class E than we'd expect from class F, but only about 1.8x as often; sherd appears about 60x more often in class E, but that adds up to only 500 extra words compared to expectations, since it's a much rarer word overall.
(BTW, log-scatter plots are fun. Those radiating spots and lines on the left side have to do with the discreteness of our set; a word can appear 1 time in a corpus or twice in a corpus, but it can't appear 1.5 times. So the lefternmost line is words that appear just once in F: the single point farthest left, at about (1.1,2.0) is words that appear twice in E and once in F; a little above it to the right is words that appear three times in E and once in F; directly to its right are words that appear four times in E and twice in F; etc.)
One possible solution would be to simply draw a line between "daimyo" and "that", and assume that words are interesting to the degree that they stick out beyond that line. That gives us the following word list, placed on that same chart:

To put it more formally: words to the left tend to be rarer (for a word to have 100,000 more occurrences than we'd expect, it has to be quite common to begin with); and there are a lot more rare words than common words. So by random chance, we'd expect to have more outliers on the top of the graph than on the bottom. By using Bookworm to explore the actual texts, I can see that "daimyo" appears so often in large part because Open Library doesn't recognize these two books are the same work. Conversely, that "our" appears 20% more often in E than in F is quite significant; looking at the chart, it seems to actually hold true across a long period time. If this is a problem with 20,000 books in each set, it will be far worse when we're using smaller sets.
That would suggest we want a method that takes into account the possibility of random fluctuations for rarer ones. One way to do this is a technique called, after its inventor, Dunning's log-likelihood statistic. I won't explain the details, except to say that like our charts it uses logarithms and that it is much more closely to our addition measure than to the multiplication one. On our E vs F comparison, it turns up the following word-positions (in green) as the 100 most significantly higher in E than F:
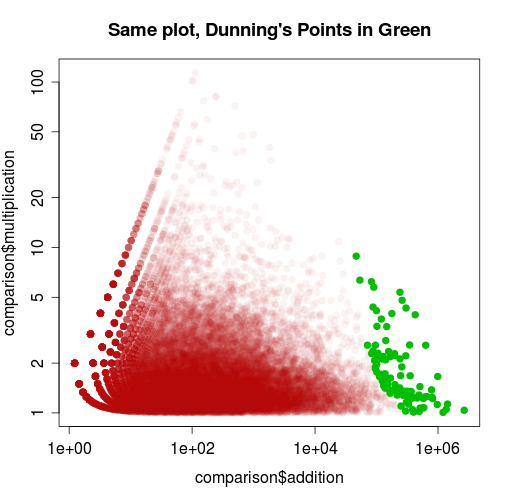
Is this satisfying? I should maybe dwell on this longer, because it really matters. Dunning's is the method that seems to be most frequently used by digital humanities types, but the innards aren't exactly what you might think. In MONK, for example, the words with the highest Dunning scores are represented as bigger, which may lead users to think Dunning gives a simple frequency count. It's not--it's fundamentally a probability measure. We can represent it like it has to do with frequency, but it's important to remember that it's not. (Whence the curve on our plot).
Ultimately, what's useful is defined by results. And I think that the strong showing of common words can be quite interesting. This ties back to my point a few months ago that stopwords carry a lot of meaning in the aggregate. If I didn't actually really find the stopwords useful, I'd be more inclined to put some serious effort into building my own log-difference comparison like the straight line above; as it is, I'm curious if anyone knows of some good ones.
As for results, here's what Dunning's test turns up in series E and in series F, limiting ourselves to uncapitalized words among the 200,000 most common in English:
Significantly overrepresented in E, in order:
[1] "that" "general" "army" "enemy"
[5] "not" "slavery" "to" "you"
[9] "corps" "brigade" "had" "troops"
[13] "would" "our" "we" "men"
[17] "war" "be" "command" "if"
[21] "slave" "right" "it" "my"
[25] "could" "constitution" "force" "what"
[29] "wounded" "artillery" "division" "government"
Significantly overrepresented in F, in order:
[1] "county" "born" "married" "township"
[5] "town" "years" "children" "wife"
[9] "daughter" "son" "acres" "farm"
[13] "business" "in" "school" "is"
[17] "and" "building" "he" "died"
[21] "year" "has" "family" "father"
[25] "located" "parents" "land" "native"
[29] "built" "mill" "city" "member"
At a first pass, that looks like local history versus military history.
At a second pass, we'll notice 'constitution' and 'government' in F and 'he' and 'parents' in E and realize that E might include biographies as well as local histories, and that F probably includes a lot of legal and other forms of national histories as well. The national words might not have turned up by my straight-line test, which seemed intent on finding all sorts of rarer military words ("skirmishers", for example).
Looking at the official LC classification definition (pdf), that turns out to be mostly be the case. (Except for biography--that ought to mostly be in E. That it isn't is actually quite interesting.) So this is reasonably good at giving us a sense of the differences between corpuses as objectively defined. So far, so good.
But these lists are a) not engaging, and b) don't use frequency data. How can we fix that? I never thought I'd say this, but: let's wordle! Wordle in general is a heavily overrated form of text analysis; Drew Conway has a nice post from a few months ago criticizing it because it doesn't use a meaningful baseline of comparison, and uses spatial arrangement arbitrarily. Still, it's super-engaging, and possibly useful. We can make use of the Dunning data here to solve the first problem though not the second. Unlike in a normal Wordle, where size is frequency, here size is Dunning score: and the word clouds are paired, so each one represents two ends of a comparison. Here's a graphic representing class E:

And then Class F:

(We could also put them together and color-code like MONK does, but I think it's easier to get the categories straight by splitting them apart like this). One nice thing about this is that the statistical overrepresentation of 'county' in class F really comes through.
On some level, this is going to seem unremarkable--we're just confirming that the LC description does, in fact, apply. But a lot of interesting thoughts can come from the unlikely events in here. For example, 'our' and 'we' are both substantially overrepresented in the national histories as opposed to the local histories. (BTW, I should note somewhere that both E and F include a fair number of historical _documents_, speeches, etc., as well as histories themselves. Here, I'm lumping them all together.) There's no reason this should be so--local histories are often the most intensely insular.
Is there a historical pattern in the second-person-plural? Bookworm says yes, emphatically--in a quite interesting way. "We's" and "Us's" are similar across E and F in the early republican period, and then undergo some serious wiggling starting around the Civil War; that leads to a new equilibrium around 1880 with E around its previous height, and F substantially lower.
Now, there doesn't have to be an interesting historical explanation for this. Maybe it's just about memoirs switching from F to E, say. But there might be: we could use this sort of data as a jumping off point for some explorations of nation-building and sectionalism. For example, clicking on the E results around 1900 gives books that use the words 'we' and 'our' the most. One thing I find particularly interesting there are the presence of many books that, by the titles at least, I'd categorize as African-American racial uplift literature. (That's a historian's category, of course, not a librarian's one). If we were to generalize that, it might suggest the rise of several forms of authorial identification with national communities (class, race, international, industrial) in the late nineteenth century, and a corresponding tendency to not necessarily see local history as first-person history. Once we start to investigate the mechanics of that, we can get into some quite sophisticated historical questions about the relative priority of different movements in constructing group identities, connections between regionalism in the 1850s vs. (Northern?) nationalism in the 1860s, etc.
We aren't restricted to questions where the genres are predefined by the Library of Congress. There is a _lot_ to do with cross corpus comparisons in a library as large as the Internet Archive collection. We can compare authors, for example: I'll post that bit tomorrow.
This isn't stuff that Martin and I could integrate into Bookworm right away, unfortunately. It simply takes too long. The database driving Bookworm can add up the counts for any individual word in about half a second; it takes more like two minutes to add up all the words in a given set of books. For a researcher, that's no time at all; but for a website, it's an eternity. Both from the user end (no one will wait that long for data to load) and from the server end (we can't handle too many concurrent queries, and longer queries means more concurrent ones).
But Wordle clouds and UI issues aside, the base idea has all sorts of applications I'll get into more later.
This is brilliant stuff. I've been taking the value of Dunning's more or less on faith. By inspecting the formula I could see that it struck some kind of compromise between the measures of difference you're characterizing as "multiplicative" and "additive," but graphing that as a log scatterplot is a fabulous idea. It makes visible exactly what kind of compromise the formula in practice strikes.
ReplyDeleteI'm very much of the opinion that, as you say, "what's useful is defined by results," and I've sometimes felt that the Dunnings results I get from MONK emphasize stopwords more than I want (perhaps just because I'm not good at interpreting them). I might be a tiny bit tempted to tinker with the Dunning's algorithm by varying the base that gets used for the log function. It's supposed to be log base e, but by fiddling with the base I bet you could stretch the "green" region a bit toward the y axis ...