There are two opportunistic reasons to think so.
1. Digital historians have always been very interested in public audiences; military history has always been one of the keenest areas of public interest.
2. The data is there for algorithmic exploration. In most countries, no organization is better at keeping structured records than the military.
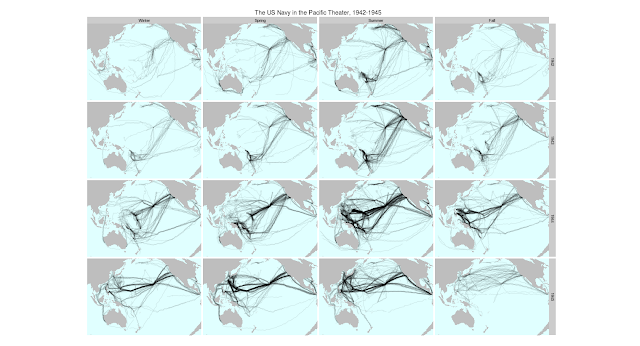
And the stuff is interesting. It's easy, for example,to pull out the locations of nearly the entire US Navy, season-by-season, in the Pacific Theater:
 |
| Click to enlarge. |
(Best in HD).
I can pull a little out of this: the closing of the Panama Canal to Japanese shipping before the war, the gradual creep of American operations up through the Pacific atolls, and so forth. But I really don't have a clue. Like a lot of historians trained at top graduate programs, one of my great fears is that some knowledgeable undergrad will expose my complete ignorance of anything about--say--the battle of Spotsylvania.
Most historians think we don't need a revival of traditional maps-and-battles military history; the cultural shift in recent decades is worth protecting, a military-digital history would confirm digital history as a boys' playground, and so forth. This is my first instinct, too. But I also sometimes wonder if the flatlining of military history in the most prestigious programs isn't part of a general failure of imagination around structural histories more generally--something I'm on record as saying digital histories might help us overcome.
The Overview project has been analyzing hundreds of thousands of reports from the Iraq War as one of its basic demonstration prototypes. I find it hard to believe that there aren't some new insights buried in all the imperfectly digitized paper the military-industrial complex creates as a matter of course.
Anyhow, just a thought.
Ben,
ReplyDeleteYou may be right about the minefield created by linking digital humanities too closely to military history. Yet wars are about nothing if not disjuncture and the potential for structural change, not just on either side of a conflict but in the midst of war itself. There has been great work suggesting that sharp divisions between military and civilian life--certainly in the U.S. Civil War era--are illusory. This is what interests me about wartime emancipation, how hundreds of thousands of soldiers made ruptures in all kinds of practices, spaces, and structures.
So thanks very much for pointing out future work to be done on military datasets. Like you, I'm hopeful that they will become interesting "new" sources to those of us not initially inclined toward battles, battalions, and the swooping arrows of old set-piece maps.
Thanks for the comment, Scott. It's an interesting point that as the military-civilian divide becomes stronger today, we project that onto the past as well, in ways that may make us understand it less.
DeleteBesides the projects you're involved with at Richmond, do you see any other significant projects bringing together the military, the digital, and the academy out there?
Thank you so much for these visualizations, they are beautiful! However, may I request that you please include what the color codes mean? What is red and what is blue, for instance, in this video?
ReplyDeleteWoops, just saw that I hadn't responded! Red is Japanese shipping (primarily merchant marine, I believe), and blue is US Navy.
DeleteBen,
ReplyDeleteI got here from your article in The Atlantic about Lincoln. Fascinating stuff. Nevertheless, your maps of US Navy movements caught my eye. Unless I'm mistaken it looks like you made them with ggplot2. I've been using the ggplot2 package to map bird movements between the Americas and Asia. You appear to have solved a problem I've as yet been unable to crack - plotting restricted lat-long zones, centred on mid-Pacific longitudes, with filled landmasses and map projection. Any chance you'd be willing share your code for so I could learn from reading it?
Regards,
Stephen
Yep, ggplot2. It's really a frustrating thing, those lines. I use an adapted version of Claudia Engel's fix from online available here.. I just put mine up here. It usually works, but sometimes I have to try a couple different nearly-next-to-each-other versions before something works.
DeleteThat is an interesting digital map, compared to WW2 shipping lane maps, as much as from what it _doesn't show_ as what it does.
ReplyDeleteThe data does not include the movements of the US Army Transportation Service freighter hulls, nor those of Mac Arthur's SWPA coastal freighter fleet of impressed Dutch Vichy French and Australian ships nor those of Mac Arthur's small boat (1,000 tons or less) fleet.
Rather than reveling new insights on WW2 it in fact obscures them.
Hi, I was wondering if you could provide a link for or information about the data set you used? Thank you
ReplyDeleteUm...I hate to be a wet blanket, but...what, exactly, are you trying to accomplish with all of this? What purpose does it serve other than creating keen graphics? Shipping zone analysis and mapping is pretty old hat. Graphics are nice, and even interesting, but I have to wonder what value they might have.
ReplyDeleteJust came across this blog as I was doing some casual research on WWII troop movements. Great data visualization on ship movments. I'm interested in the underling data. I've done some searching but the closest I can find is log book data. Could you provide a link to the underlying data set? And thanks also for the link to the ggplot code! I've been using ggplot myself for a while now but haven't tried my hand at maps yet.
ReplyDelete